SD -- standard deviation
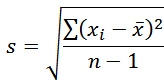 sum of (each datum - mean)2
divide by n-1
sqrt
The most important statistic.
It's so important that you should calculate one manually.
Data x-mean (x-mean)2
---- ------ ----------
1
2
3
4
5
6
7
8
9
---------
Sum=_____ Sum/(n-1)=______ Sqrt(sum/(n-1))=s=________
Which of these datums have the biggest effect on the Sum (and thus on the SD)?_____
So, in general, the datums that are _______ from the mean have the biggest effect on the SD.
Now add a 1 and a 9 to the data, mean stays the same;
increases the Sum by their squared difference from the mean
Sum=_____ Sum/(n-1)=______ Sqrt(sum/(n-1))=s=________
made a big or small (relative) difference?:______
****************************************************************************
freq dist, histogram, stats ***
Type in five 1's. 1 1 1 1 1
mean=_____ SD=_________
i.e. all the data is the same, there is NO variation.
it is all [clustered] at the mean. (This is the only way for the SD to be 0.)
Boxplot is unusual? __Y __N
Sketch histogram from 0 to 10, Y max 10, class width 1.
Clear
Type in five 9's. 9 9 9 9 9
mean=_____ SD=_________
Again, no variation.
ADD five 1's 9 9 9 9 9 1 1 1 1 1
mean=_____ SD=_________
this data is maximally spread out (for a range of 8), it is perfectly bi-modal, so
SD (σ) is one half the range: range=____ σ=_____
BTW, the mean is usually said to be the "typical" datum. Is that the case here?:___
Boxplot is unusual? __Y __N
Sketch histogram from 0 to 10, Y max 10, class width 1.
Clear
Type one 1, eight 5's, one 9: 1 5 5 5 5 5 5 5 5 9
mean=_____ (same as the five 1's with five 9's)
SD=______ (much smaller than the previous data set)
Boxplot is unusual? __Y __N
Sketch histogram from 0 to 10, Y max 10, class width 1.
Clear
1 2 3 4 5 6 7 8 9
mean=______
SD=_____ SD is not directly related to the number of different numbers.
Sketch histogram from 0 to 10, Y max 10, class width 1.
sum of (each datum - mean)2
divide by n-1
sqrt
The most important statistic.
It's so important that you should calculate one manually.
Data x-mean (x-mean)2
---- ------ ----------
1
2
3
4
5
6
7
8
9
---------
Sum=_____ Sum/(n-1)=______ Sqrt(sum/(n-1))=s=________
Which of these datums have the biggest effect on the Sum (and thus on the SD)?_____
So, in general, the datums that are _______ from the mean have the biggest effect on the SD.
Now add a 1 and a 9 to the data, mean stays the same;
increases the Sum by their squared difference from the mean
Sum=_____ Sum/(n-1)=______ Sqrt(sum/(n-1))=s=________
made a big or small (relative) difference?:______
****************************************************************************
freq dist, histogram, stats ***
Type in five 1's. 1 1 1 1 1
mean=_____ SD=_________
i.e. all the data is the same, there is NO variation.
it is all [clustered] at the mean. (This is the only way for the SD to be 0.)
Boxplot is unusual? __Y __N
Sketch histogram from 0 to 10, Y max 10, class width 1.
Clear
Type in five 9's. 9 9 9 9 9
mean=_____ SD=_________
Again, no variation.
ADD five 1's 9 9 9 9 9 1 1 1 1 1
mean=_____ SD=_________
this data is maximally spread out (for a range of 8), it is perfectly bi-modal, so
SD (σ) is one half the range: range=____ σ=_____
BTW, the mean is usually said to be the "typical" datum. Is that the case here?:___
Boxplot is unusual? __Y __N
Sketch histogram from 0 to 10, Y max 10, class width 1.
Clear
Type one 1, eight 5's, one 9: 1 5 5 5 5 5 5 5 5 9
mean=_____ (same as the five 1's with five 9's)
SD=______ (much smaller than the previous data set)
Boxplot is unusual? __Y __N
Sketch histogram from 0 to 10, Y max 10, class width 1.
Clear
1 2 3 4 5 6 7 8 9
mean=______
SD=_____ SD is not directly related to the number of different numbers.
Sketch histogram from 0 to 10, Y max 10, class width 1.